
The site currently is bouncing between positions 1 and 3 on Google for its primary keyword “best survival knife”, and is enjoying significant traffic from lots of other keywords as well. In my full report today, I’m going to share exactly how much traffic the site is getting and where its coming from.
In addition, I will be sharing the total amount of money made, expenses, and much more.
Traffic Stats
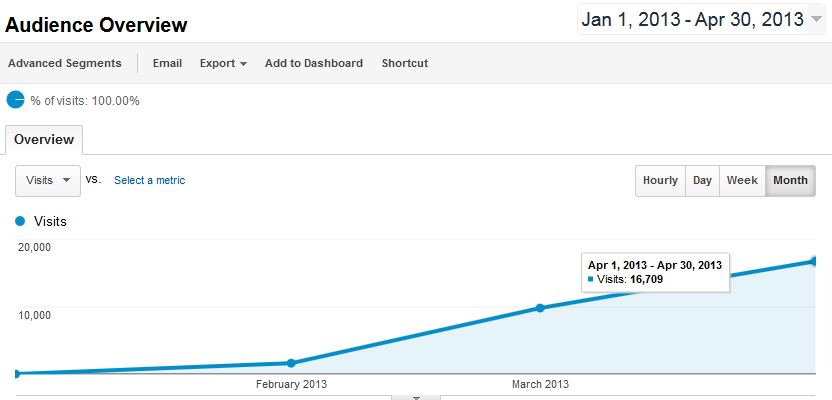
Before I jump right into the earnings of the site, I want to share the amount of traffic coming to the site. First, here’s a screenshot of how the traffic has grown since it was created (in mid February):
Click to Enlarge
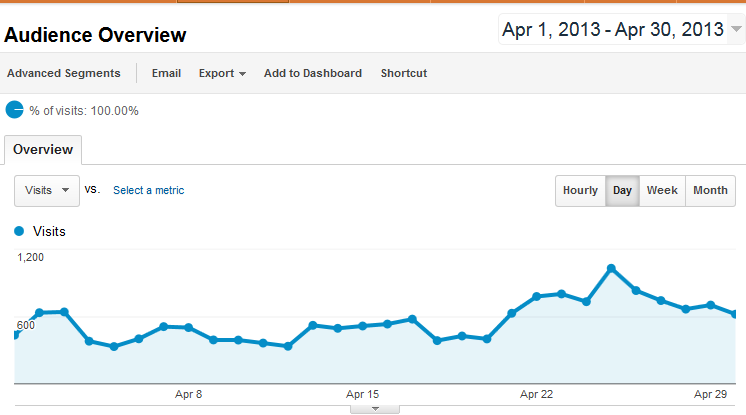
The site has gone from ZERO visits in January to 16,709 visits in April! That really is some amazing growth. Now here is a screenshot of the Google Analytics for the month of April.
Click to Enlarge
You will notice around April 21st when my site started bouncing up to position 1 and 2 on Google – and the traffic has consistently been higher since then. Also, you will notice some additional that the traffic is pretty high and there are some additional peaks.
This is basically explained because of people that read NichePursuits.com checking in on my site frequently and in particular when I publish a new blog post here. As a result, a little over 34% of the traffic coming to the site is Returning visitors.
So, really around 66% of the visitors to the site are NEW visitors, which is really still quite good. (And even normal niche sites will have a certain amount of “returning visitors”, so the entire 34% is not all readers of my blog here).
Where is the Traffic Coming From?
Most of the traffic to the niche site is coming from Google. However, a few other search engines are doing their best to send me a little bit of free traffic. Here’s the breakdown (I think I’ll keep focusing on Google ![]() ):
):
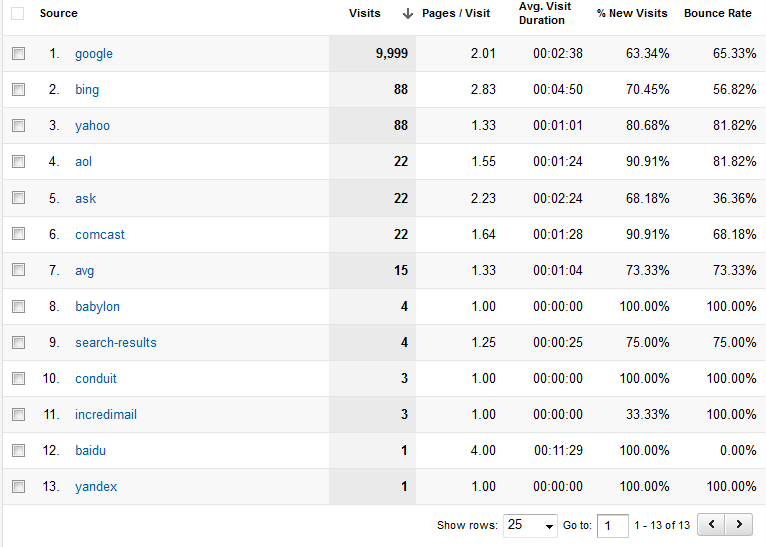
I didn’t do anything to get search traffic from these other search engines. I only did what I’ve already laid out extensively in this case study.
Approximately 61% of the traffic is coming from search engines, and about 33% is coming from direct traffic (a large portion of this direct traffic is probably my blog readers here). Here’s the pie chart:

Keywords Used to Find My Site
Now we come to my second favorite part of this report (my favorite is the income), seeing all the keywords used to find my site! I am actually surprised at the HUGE variety of keywords being used to find my site. Sure, I expected a lot of different long tail keywords based on the various articles produced for the site; however, I’m impressed with the amount of keyword queries that are being used to find my site.
I did all my research for the primary and secondary keywords using my keyword research tool, Long Tail Pro.
Here’s a couple of screenshots to show the most popular keywords and some of the longer tailed keywords:

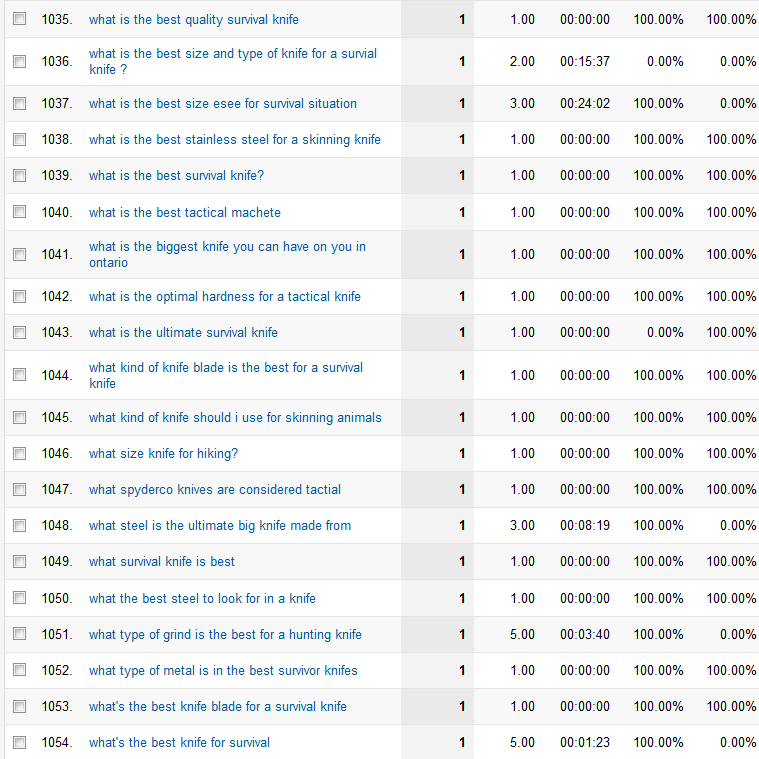
In total, I received search engine traffic from 1,083 search queries in the month of April. The term, “best survival knife” was by far my biggest search query, but you can see in aggregate, that MOST of my traffic is coming from other keywords. This is normal and should be expected.
However, you will also notice that many of the keywords include either “best” or “survival knife”. This is one reason why its important to focus on one primary keyword to start because you get both the searches for that exact keywords and lots of related searches. Then I am clearly getting lots of searches to my additional content on the site (not just my primary article).
Income For April 2013
For the month of April, I continued to exclusively use the Amazon Associates program to monetize my site. The income for April was $356.42! Sweet!!
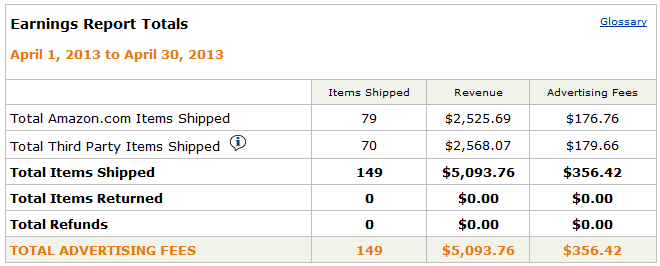
To remind you, the earnings in March was $83.86 (see report here). The primary reason for the month to month increase in revenue is due to the increased traffic.
So, overall, the site has made me $440.28.
Also, out of the 149 items purchased, most of them were knives or very similar camping/survival items. I thought some of you would find it interesting to see some of the items purchased, so here’s a couple of screenshots of where my commissions came from:

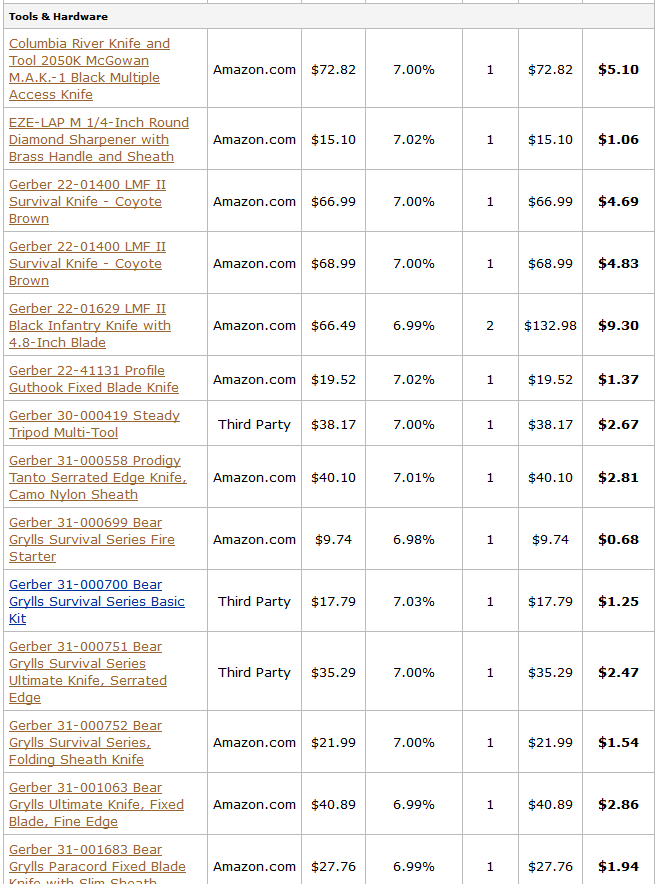
I am using the EasyAzon plugin to insert and manage the Amazon affiliate links on my site. The plugin makes it much quicker to find and insert links as well as change certain settings (like cloaking, ad previews, and more).
Overall Expenses
Seeing the income is nice, but its also important to take a look at the expense side of things. I’ve detailed previously here what my expenses had been up to that point; however, I am going to cover everything here.
- Domain name with Privacy: $10
- Hosting with Bluehost: $17.85 (3 months at $5.95/mth). However, I also can share this hosting account with other sites, so the true expense is spread out with lots of sites.
- Articles: $392. There are currently 22 articles on the site. (So, that’s an average of $17.82/article…yes this is more than I usually pay).
- Link Building: $244. About $25 for a VA to submit my site to web directories; then $219 for link building service through LayeredLinks.com. A big part of the influence for my overall link building strategy came from the Link Building course called Point Blank SEO. I highly recommend it if you want to do your own link building or learn more about how a good link building strategy should work.
- Graphics: $50
- I am using the Niche Website Theme (which I created) on my niche site. Since I already own the product, I’m not putting it as an expense. However, its currently being sold at a discount right here.
So, in total, I’ve spent $713.85. Subtracting my overall income leaves me with a net loss of $273.57. If this site does as well as it did in April, I will turn a profit in May. And I actually expect that the site will earn more in May than April because it should have a full month near the top of Google.
My expenses will also be significantly less as many listed above were one-time costs. I may spend another $100 or so on articles in May, but that should be about it for the expense side. So, if I hit my goal of earnings $500/mth starting in May; I will have a passive income stream of $500 each month on a total investment of less than $900! That’s a really high Return on Investment obviously.
Plans Going Forward
Overall, I am SUPER happy with the way this niche site has turned out. The site is doing very well, and I hope the success continues for a long time to come. My plans going forward are fairly simple at this point. I will continue to add between 5 and 10 articles to the site in May, and possibly in June as well. Depending on how the site is doing, I will re-evaluate in a month or so if I should ramp up the content even more or if I should just leave the site as is.
I have been building a small email list, but haven’t quite figured out what to do with it yet. I have a 4 part auto-responder series that is likely bringing people back to the site, but I’d like to explore some affiliate opportunities. Hopefully in May, I can find a good fit. I currently have 67 subscribers on the survival knife email list. I could likely add a ton more by adding a splash page or pop up.
Your Thoughts
As always, I want to be as open about this case study as possible. I think that I’ve provided some valuable stats, screenshots, and more on this income report that can help you evaluate what’s going on with my niche site. However, I also know that you may have additional questions that you would like clarification on…I’m here for you!
So, please leave any thoughts or questions that you might have below.
http://www.nichepursuits.com/niche-site-project-income-report-for-april-2013/#
0 comments:
Post a Comment